Selecting an Approach Speed
- Details
- Written by Kevin Horton
- Hits: 5187
Many type-certificated aircraft, especially Transport Category aircraft, have a landing reference speed (Vref) that is equal to 1.3 times the stall speed. Some owners of amateur-built aircraft believe that they can select an appropriate approach speed by simply noting the indicated airspeed reading at the stall, and multiply this by 1.3. This approach is not appropriate in many cases.
Many aircraft have significant airspeed system errors at low speed. A landing reference speed (Vref) of 1.3 times the stall speed only provides the expected margin from the stall if it is based on calibrated airspeeds. I.e multiply the CAS at the stall by 1.3, and then fly at this CAS. Many airspeed systems under read at the stall. If the IAS at the stall is multiplied by 1.3, one may be much closer to the stall than expected. For example, the POH for the Cessna 182Q that I fly once in a while says the max weight, aft CG landing configuration stall is at 50 KCAS or 38 KIAS. If we fly at 1.3 times 38 KIAS, that is 49 KIAS. The position error chart says that 49 KIAS = 55 KCAS, or 1.1 times the stall speed. Anyone who tried to fly an approach at 49 KIAS would likely get a nasty surprise when they tried to flare.
It is quite unlikely that very many amateur-built aircraft owners have the means to determine the calibrated airspeed at the stall. So there is no practical way to determine an approach speed that is 1.3 times the CAS at the stall. What is a fellow to do? I recommend the following, based on the flight tests that are used to determine minimum safe approach speeds for both light aircraft and transport category aircraft:
- Fly the aircraft enough to have developed a consistent normal approach technique.
- Ballast the aircraft to max landing weight at forward CG. Make sure the ballast is well secured.
- Climb to a safe altitude, and conduct a series of simulated approaches and landing flares, using the same technique as you would use in a real approach and landing. Reduce the simulated approach speed by a knot or two each time. Note the aircraft controlability at the approach speed, and note the ability to flare. Note the minimum speed where the aircraft has satisfactory characteristics.
- Pick a day with very light winds and no turbulence or wind gusts. The best time to find such conditions is right after sunrise, but even then there may be several weeks between days with suitable conditions. Be patient. Don't risk a hard landing by doing these tests on a day with gusts or turbulence.
- Fly a series of approach and landings, using your normal approach and landing technique, but reducing the approach speed by a knot or two each time. Pay attention to how the aircraft responds to the flight control inputs in the flare. Note any signs of inadequate control, impending stall, difficulty in obtaining a satisfactory touchdown, etc. As you reduce the approach speed, eventually the aircraft will start talking to you. It will tell you that you shouldn't reduce the approach speed any further, or you will risk a hard landing, etc.
- Caution - Don't be too aggressive about trying to demonstrate the absolute minimum possible speed. This path leads to a hard landing, and possible aircraft damage. Stop the investigation when you have a slow minimum speed that allows an acceptable flare and touchdown, using your normal technique.
- The following restrictions, from the requirements for type-certificate aircraft, are recommended to ensure that a minimum speed approach and landing demonstration is not a "party trick":
- Once the power has been brought to idle, there should be no need to increase the power. By all means, if you need to increase power to achieve a safe touchdown, increase the power. But you should conclude that perhaps the approach speed was too low, and the minimum approach speed should be increased.
- The power changes that are made should be the same as would be made during a normal approach and landing. E.g, if a normal approach and landing has the power brought to idle in the flare, it should be possible to do the same during the demonstration of the minimum approach speed.
- Add a comfortable increment (perhaps 5 kt) to this minimum demonstrated approach speed, and this becomes your minimum operational approach speed, to only be used in calm conditions. If the conditions are not smooth, add a few more knots, so that as the airspeed bounces around in the bumps, the bottom of the bounces is no lower than your minimum operational approach speed.
- Confirm the ability to safely manoeuvre at your minimum operational approach speed by conducting turns at that speed at a bank angle that is a bit higher than the highest you would use in service. You should be able to maintain a stabilized turn without encountering stall warning. Increase the minimum operational approach speed if required to obtain satisfactory manoeuvring capability.
- If you have a short field landing technique that differs from your normal landing technique (perhaps you keep power on until touchdown, and use a minimal flare, etc), repeat the above series of tests using a short field technique. You may have different minimum approach speeds for normal and short field landings.
If you later change ASIs, or make any changes that affect static system errors or stall speed, repeat the above series of tests.
Errors - Kitplanes - "How Fast is Fast"
- Details
- Written by Kevin Horton
- Hits: 3217
The table of ASI reading vs water manometer height in the "How Fast is Fast" article in the April 2007 issue has errors. The errors are small at low speed, but there is about a 4 kt error at the highest speeds in the table. I'm not sure where those numbers came from.
The CAS for a given pressure is equal to asl*SQRT(5*((P/Psl+1)^(2/7)-1)) [reference test pilot school notes].
where:
asl = speed of sound at sea level (661.48 kt or 761.22 mph)
Psl = atmospheric pressure at sea level (407.513" H2O at 20 deg C, or 10350.8 mm H2O)
The above values are from NASA Reference Paper 1046, Measurement of Aircraft Speed and Altitude, Tables A19 and A27.
Corrected ASI vs water manometer height:
| Speed | in. | mm | | | Speed | in. | mm |
| (mph) | H2O | H2O | | | (kt) | H2O | H2O |
| 15 | 0.11 | 2.8 | | | 15 | 0.15 | 3.7 |
| 20 | 0.20 | 5.0 | | | 20 | 0.26 | 6.6 |
| 25 | 0.31 | 7.8 | | | 25 | 0.41 | 10.4 |
| 30 | 0.44 | 11.3 | | | 30 | 0.59 | 14.9 |
| 35 | 0.60 | 15.3 | | | 35 | 0.80 | 20.3 |
| 40 | 0.79 | 20.0 | | | 40 | 1.04 | 26.5 |
| 45 | 1.00 | 25.3 | | | 45 | 1.32 | 33.6 |
| 50 | 1.23 | 31.3 | | | 50 | 1.63 | 41.5 |
| 55 | 1.49 | 37.9 | | | 55 | 1.98 | 50.2 |
| 60 | 1.77 | 45.1 | | | 60 | 2.35 | 59.7 |
| 65 | 2.08 | 52.9 | | | 65 | 2.76 | 70.1 |
| 70 | 2.42 | 61.4 | | | 70 | 3.20 | 81.4 |
| 75 | 2.78 | 70.5 | | | 75 | 3.68 | 93.4 |
| 80 | 3.16 | 80.2 | | | 80 | 4.19 | 106.4 |
| 85 | 3.57 | 90.6 | | | 85 | 4.73 | 120.1 |
| 90 | 4.00 | 101.6 | | | 90 | 5.31 | 134.8 |
| 95 | 4.46 | 113.3 | | | 95 | 5.91 | 150.2 |
| 100 | 4.94 | 125.6 | | | 100 | 6.56 | 166.5 |
| 105 | 5.45 | 138.5 | | | 105 | 7.23 | 183.7 |
| 110 | 5.99 | 152.1 | | | 110 | 7.94 | 201.8 |
| 115 | 6.55 | 166.3 | | | 115 | 8.69 | 220.7 |
| 120 | 7.13 | 181.2 | | | 120 | 9.47 | 240.4 |
| 125 | 7.74 | 196.7 | | | 125 | 10.28 | 261.1 |
| 130 | 8.38 | 212.9 | | | 130 | 11.12 | 282.6 |
| 135 | 9.04 | 229.7 | | | 135 | 12.01 | 304.9 |
| 140 | 9.73 | 247.2 | | | 140 | 12.92 | 328.2 |
| 145 | 10.44 | 265.3 | | | 145 | 13.87 | 352.4 |
| 150 | 11.18 | 284.1 | | | 150 | 14.86 | 377.4 |
| 155 | 11.95 | 303.5 | | | 155 | 15.88 | 403.3 |
| 160 | 12.74 | 323.7 | | | 160 | 16.94 | 430.2 |
| 170 | 14.41 | 365.9 | | | 170 | 19.15 | 486.5 |
| 180 | 16.17 | 410.8 | | | 180 | 21.52 | 546.5 |
| 190 | 18.05 | 458.5 | | | 190 | 24.02 | 610.2 |
| 200 | 20.03 | 508.9 | | | 200 | 26.68 | 677.6 |
| 210 | 22.13 | 562.0 | | | 210 | 29.48 | 748.8 |
| 220 | 24.33 | 617.9 | | | 220 | 32.44 | 823.9 |
| 230 | 26.64 | 676.7 | | | 230 | 35.54 | 902.8 |
| 240 | 29.07 | 738.3 | | | 240 | 38.80 | 985.6 |
| 250 | 31.61 | 802.8 | | | 250 | 42.22 | 1072.4 |
As a sanity check on the above calculated values, NASA Reference Paper 1046 has tables of pressure vs ASI readings, with the pressure in units of mm Hg. At 250 kt, table A23 has a pressure of 78.744 in Hg. At 20 deg C, 1 mm Hg is equal to 0.53577 " H2O. So, 250 kt would be 42.19" of H2O. This is within 0.1 kt of the values I have provided above. NASA Reference Paper 1046 is available for free download from NASA.
http://hdl.handle.net/2060/19800015804 (14 MB PDF file)
I have created Excel and OpenOffice spreadsheets that will convert back and forth between ASI reading and water manometer height. They are available at:
Ignition Coil Mount
- Details
- Written by Kevin Horton
- Hits: 3451
This has not been the most productive month. I spent a week in Vancouver, and "wasted" way too much time just enjoying the spring weather.
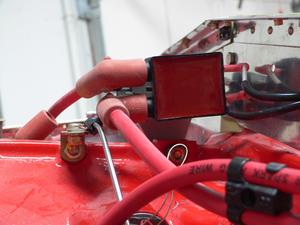 The Light Speed electronic ignition system uses two ignition coils, each firing two spark plugs. The system comes with a light weight aluminum coil bracket which is intended to be bolted on top of the engine using one of the bolts that hold the case halves together. The supplied bracket probably works very well on a carbureted engine, but I found that the coils, or the bracket, would interfere with the fuel injection lines on top of the engine. I couldn't move the coils aft, as there was no more room before hitting the rear baffle wall.
I made a taller bracket (pictured), but there really wasn't enough clearance between one of the spark plugs wires exiting the coil and one of the tiny fuel injection lines. This looked like trouble in the making, so I made an even taller bracket, to increase the clearance. I discovered that while I now maybe had enough clearance to the fuel injection line, the coils hit the aluminum plenum cover. Arrgh.
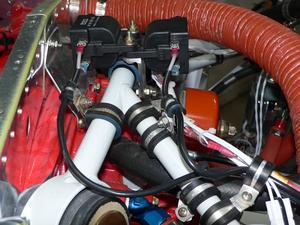 I decided to move the coils aft, on a bracket attached to the engine mount. I made a bracket, then discovered that while most of the engine mount tubes are 3/4" diameter, the one I wanted to use was 7/8" diameter, and that meant that this beautiful bracket wouldn't work. So, I made yet another bracket, and this one looks like a winner. I will need to purchase longer ignition wires though.
This week I made a concerted effort to attack the smaller items on the To Do list. Not too long ago that list was about a page and a half long, but now it is almost down to one page. I had hoped to have it done to less than a page by tonight, but Terry discovered that we had a minor flood in the basement from a leaking hot water tank. I shutdown the tank, drained it, and mopped up the water. Tomorrow I hope to have the tank replaced. Cold shower tomorrow morning. Ugh.
Securing Alternator Cable
- Details
- Written by Kevin Horton
- Hits: 4036
I was away Monday and Tuesday, and I've also spent some time working on taxes. Today we did a trip out to Lanark County to visit Wheeler's Pancake House and Sugar Camp, as the maple sap is running, and they have a fresh batch of maple syrup. What a feed!. So not a great week from an RV-8 progress perspective.
I did finish fabricating the big cables that go from the alternator to a current limiter on the firewall, and then connects to the main electrical system at the starter contactor. Big cables like this are not very flexible, so you need to be careful to get the ring terminals soldered at the right angle so they will fit nicely over the threaded studs.
Next, I needed to find a good way to secure the alternator cable as ran underneath the cylinders on the left side of the engine. I decided to run it right alongside the starter cable, which I had previously secured with an Adel clamp to one of the studs that attached the oil sump.
I removed the Adel clamp that secured the starter cable, but found that it was going to be pretty much impossible to secure the two cables to this location. There isn't much room to work in that area, and after I had secured the starter cable I had installed the mixture cable, which effectively blocked the needed access to this area. I wasn't prepared to remove and reinstall the mixture cable, so I had to come up with Plan B.
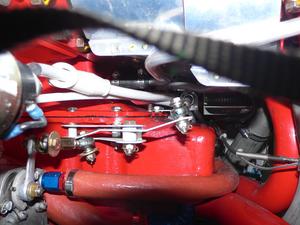 In this shot from the front you can see the while starter and alternator cables, the threaded stud where the Adel clamp had been, and the mixture bellcrank.
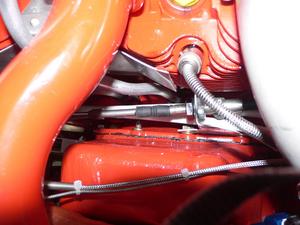 This shot, from the left side, shows the mixture cable, the threaded stud and the two big electrical cables I needed to secure.
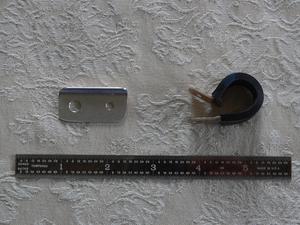 The big problem when attaching Adel clamps is that the clamp is very springy, and it wants to open up. But, you need to have it closed so you can put both holes over the stud, then get a washer and nut on. There are various techniques to hold the clamp closed while you secure it, but none of the ones I use would work well in this very tight space. I decided to try using a small metal standoff with two holes so I could attach the clamp to one hole, then put the other hole over the oil sump stud. I had to use a different stud on the oil sump, but the basic idea worked very well. It allowed me to secure the Adel clamp while it was at a suitable angle to allow me to hold it closed with a pair of hemostats.
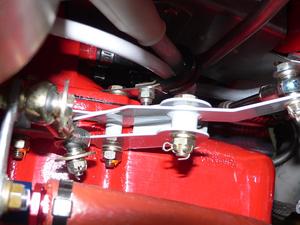 Here are the two cables secured in their Adel clamp. I have to secure them at the engine mount, but that shouldn't be quite as big a battle.
Firewall Insulation 3
- Details
- Written by Kevin Horton
- Hits: 3661
I'm back in a busy travel mode for a couple of weeks. Last week I was in Winnipeg for most of the week, and got home Saturday afternoon. I'm back on the road again tomorrow until mid-week.
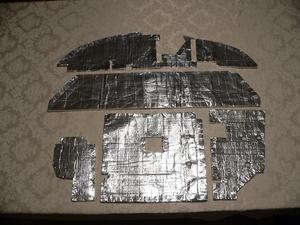 I got the last piece of the firewall insulation finished before heading to Winnipeg. Eventually I'll stick it in place with Velcro, but that will come later, so hopefully I won't have to rip it back out again before first flight.
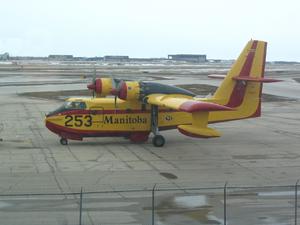 The trip to Winnipeg was interesting, as the project was on a Canadair CL-215 water bomber. It was very nice to hear the sound of big radial engines again. It has been almost 20 years since I stopped flying the Grumman Tracker.
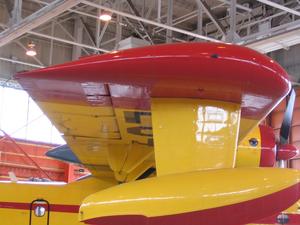 Look how thick the airfoil on that wing is.
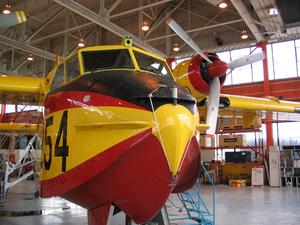 Not exactly an aerodynamic nose.
Power vs Speed
- Details
- Written by Kevin Horton
- Hits: 6384
An RV-6A owner contacted me Friday wondering about how to take cruise speed vs power data from one altitude and correct them to a different altitude. He wants to produce the data for a series of cruise performance tables for a wide range of altitudes, then do a small test program to validate them. He wondered if he could make use of the rule of thumb that speed varies with the cube root of power. I sent him a long response, and an Excel spreadsheet, but I figured that some other people might be interested in this topic too.
I'll offer two approaches - one that is simple, and probably not so accurate, and a more complex, but more accurate one.
