More Fall Colours
- Details
- Written by Kevin Horton
- Hits: 3091
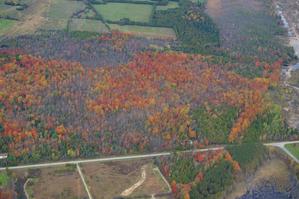 I did a short flight on Saturday morning, checking out the fall leaves again. They still have a little ways to go to hit their peak.
Fall Colours
- Details
- Written by Kevin Horton
- Hits: 3143
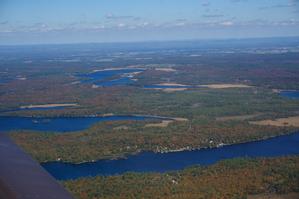 It was a beautiful fall day today, and the leaves are starting to show their colours, so I went flying to have a look. We’re still a week or more from peak colours, but it was still worth the flight. I was in no rush, so I toddled along at 125 kt TAS, burning 5.2 GPH.
Climb Tests Corrected to Standard Conditions
- Details
- Written by Kevin Horton
- Hits: 3117
I spent a few hours this week correcting the climb test data to standard temperature and 1800 lb gross weight. I used the Density Altitude method, as described in FAA Advisory Circular 23–8C, Flight Test Guide for Certification of Part 23 Airplanes.
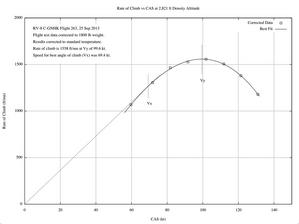 Data from the 2500 ft pressure altitude point, corrected to 2821 ft density altitude. The temperature on 25 Sept was warmer than standard, so the density altitude was higher than the test pressure altitude.
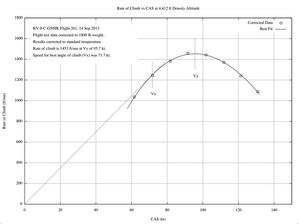 Data from the 4500 ft pressure altitude point, corrected to 4412 ft density altitude. The temperature on 14 Sept was colder than standard, so the density altitude was lower than the test pressure altitude.
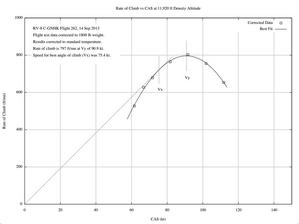 Data from the 11,000 ft pressure altitude point, corrected to 11,920 ft density altitude.
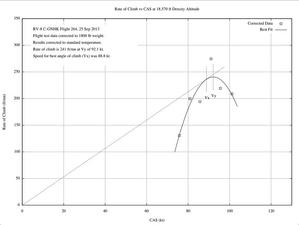 Data from the 17,000 ft pressure altitude point, corrected to 18,570 ft density altitude. I was happy to see that the corrected data for the tests at 17,000 ft makes a bit better, if still ugly, curve than the original raw data.
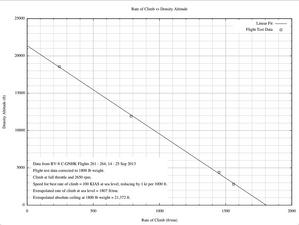 The four test points fall fairly close to a straight line. If I project that straight line to sea level, I get a rate of climb of 1807 ft/mn.
Note that the prop governor is giving 2650 rpm once the oil warms up. I looked at adjusting it to give 2700 rpm, but the actuating arm is hitting the stop. I would need to move the arm on its splined shaft, and the access back there is poor enough that I decided to leave things alone. The engine would make about 4 more hp at sea level if it was running at 2700 rpm, and that extra power would give about an extra 53 ft/mn rate of climb, giving 1860 ft/mn. Vans Aircraft claims 1900 ft/mn, and all their rate of climb specs are rounded off to the nearest 100 ft/mn, so my results are consistent with their performance claims.
More Climb Performance Testing
- Details
- Written by Kevin Horton
- Hits: 3436
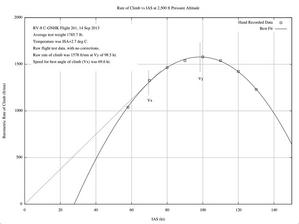 The weather was perfect on Wednesday, and I had nothing pressing scheduled at work, so I took the day off to do more climb testing. I got airborne shortly after sunrise to catch the early morning smooth air. I did eight climbs from 1500 ft to 3500 ft, with speeds from 58 KIAS to 130 KIAS. The raw data looks very good, and shows the classical curve of rate of climb vs speed.
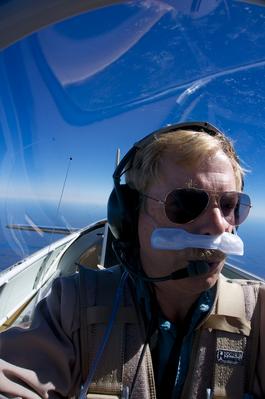 I gassed up, turned on the oxygen system, and climbed up to 17,000 ft to do some high altitude climb testing. I donned the cannula as I climbed through 10,000 ft.
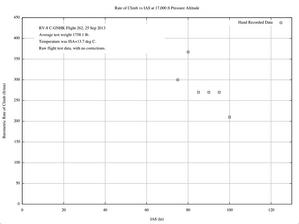 I should have paid more attention to the predicted temperature at altitude, as it was a lot warmer up there than I had anticipated (about 14 deg C warmer than standard temperature). The extremely warm temperature reduced the engine power, and impacted the rate of climb. The density altitude at the end of each climb was over 19,000 ft. Many of the 1000 ft climbs took over 3 minutes, with the longest taking over 4 minutes. I was not able to do any climbs at low airspeed, as the oil temperature would get too high in the late part of the climb. The aircraft was very delicate to fly, and it was difficult to accurate hold a constant airspeed.
The resulting data of rate of climb vs airspeed isn’t nearly as pretty as the lower altitude data. I’ve got a pretty good idea what the maximum rate of climb was, but no idea what the airspeed for best rate of climb was. In retrospect, it would have been more productive to do the climbs at a bit lower altitude, as the higher rate of climb may have allowed climbs at lower airspeed to flesh out the left side of the curve.
I had wondered whether it would be practical to cruise at 17,000 ft. I concluded from this flight that it is possible, but only worth it if the high alitude allows taking advantage of very strong tailwinds, or a much shorter route.
Climb Performance Testing
- Details
- Written by Kevin Horton
- Hits: 3730
I did two climb performance flights six days ago, on Saturday, 14 Sept. I meant to post about them earlier, but we had family visiting, which ate up most of my spare time.
I had done some climb performance testing shortly after the first flight, in 2008. But that was with the original Hartzell prop, and I had never done any similar tests with the current MT prop. The weather was clear on Saturday, and the temperature was fairly close to standard (15 deg C at sea level), so I decided to have a go at this.
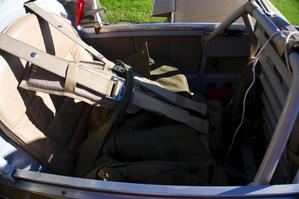 I used some cheap exercise weights as ballast, in a very tough military duffle bag, strapped down in the rear seat. Additional ballast went in the forward baggage area, to get the take-off weight up to about 1835 lb. The design gross weight is 1800 lb, so I wanted get data at that weight. The weight decreases as the fuel is burned during the test flight, so the starting weight must be above 1800 lb. I have approval to fly at up to 1900 lb.
I had hoped to get climb data starting as low as 1000 ft above ground level, but the surface winds gusting to 15 or more knots created too much low altitude turbulence to allow good quality testing. I finally found smooth air from 3000 ft and up, so I chose a test block of 3500 ft to 5500 ft. I timed two climbs at speeds from 60 kt to 130 kt, in 10 kt increments. The winds were predicted to be from 340 degrees, so the two climbs at each speed were at 070 and 250 degrees, to put the wind on the wing tip. I averaged the rates of climb from each of the two runs at each speed.
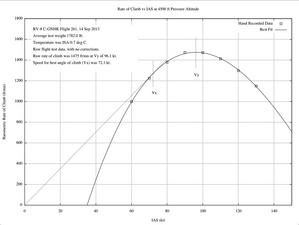 The raw data from the morning flight at an average test altitude of 4500 ft shows the classical variation of rate of climb with airspeed. The maximum rate of climb would be at approximately 96 kt, but the curve has a fairly flat top, so the rate of climb is within 95% of the maximum from 82 kt to 111 kt.
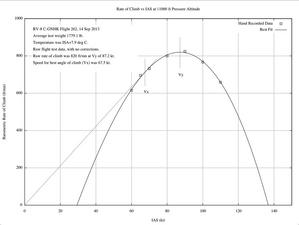 After lunch I gassed up, and did another series of climbs from 10,000 ft to 12,000 ft. The speed for maximum rate of climb decreased as the altitude increased, as expected. At 11,000 ft, the speed for maximum rate of climb has decreased to 87 kt.
I also had my ancient PowerBook G4 running to record data, so I’ll look at that to hopefully get a bit cleaner curve of rate of climb vs speed. I’ll also correct the results to 1800 lb and standard temperature.
I hope to get another set of data at higher altitude in the next week. I’ll turn on the oxygen and do some climbs around 17000 ft.
Back Home
- Details
- Written by Kevin Horton
- Hits: 3091
I flew back from Yarmouth on Tuesday, IFR at 8000 ft, on top or between layers the whole way. The headwinds were quite variable and stronger than forecast, with the ground speed down to 125 kt at times. 3:21 from take-off to touchdown, over a route of 475 nm.
Today I pulled the cowling to inspect the exhaust system - no cracks. I did spot one small oil weep at the oil screen plug. I’d have to drain the oil to change the crush washer, so I’ll just leave it alone.
