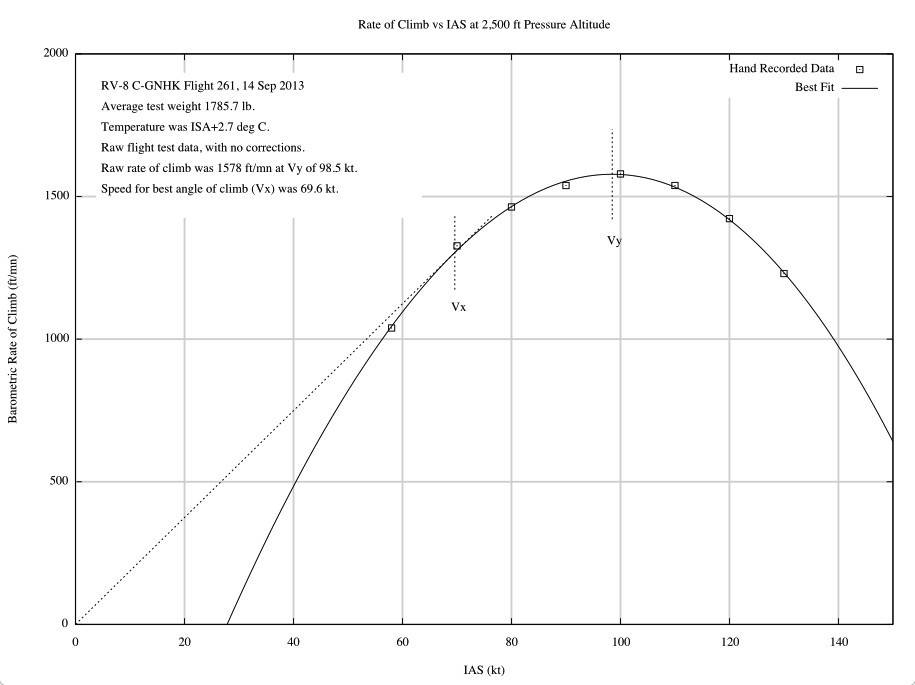
 The weather was perfect on Wednesday, and I had nothing pressing scheduled at work, so I took the day off to do more climb testing. I got airborne shortly after sunrise to catch the early morning smooth air. I did eight climbs from 1500 ft to 3500 ft, with speeds from 58 KIAS to 130 KIAS. The raw data looks very good, and shows the classical curve of rate of climb vs speed.
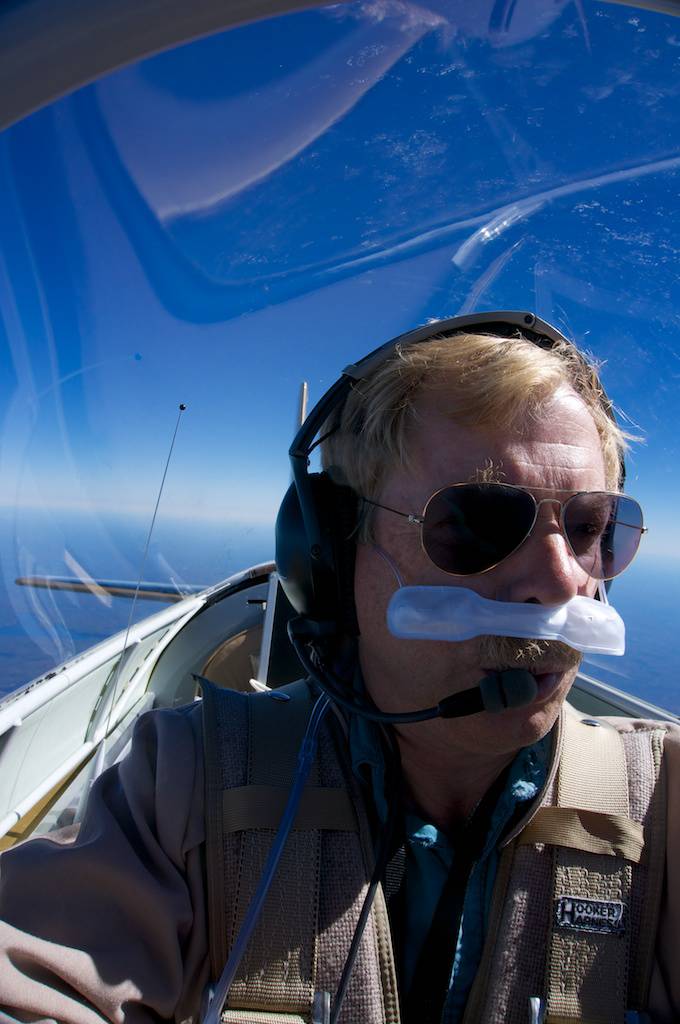 I gassed up, turned on the oxygen system, and climbed up to 17,000 ft to do some high altitude climb testing. I donned the cannula as I climbed through 10,000 ft.
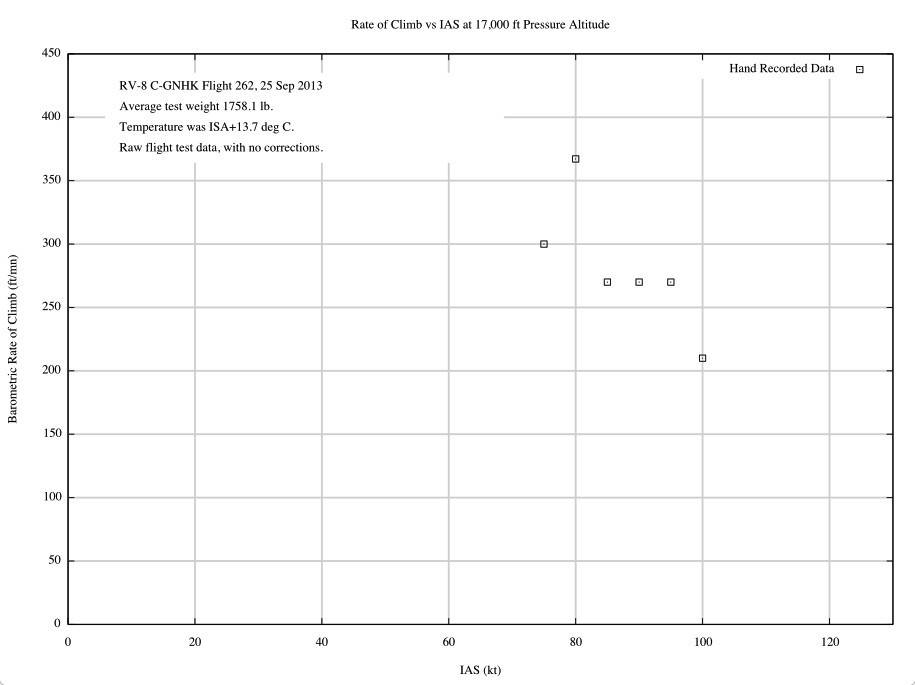 I should have paid more attention to the predicted temperature at altitude, as it was a lot warmer up there than I had anticipated (about 14 deg C warmer than standard temperature). The extremely warm temperature reduced the engine power, and impacted the rate of climb. The density altitude at the end of each climb was over 19,000 ft. Many of the 1000 ft climbs took over 3 minutes, with the longest taking over 4 minutes. I was not able to do any climbs at low airspeed, as the oil temperature would get too high in the late part of the climb. The aircraft was very delicate to fly, and it was difficult to accurate hold a constant airspeed.
The resulting data of rate of climb vs airspeed isn’t nearly as pretty as the lower altitude data. I’ve got a pretty good idea what the maximum rate of climb was, but no idea what the airspeed for best rate of climb was. In retrospect, it would have been more productive to do the climbs at a bit lower altitude, as the higher rate of climb may have allowed climbs at lower airspeed to flesh out the left side of the curve.
I had wondered whether it would be practical to cruise at 17,000 ft. I concluded from this flight that it is possible, but only worth it if the high alitude allows taking advantage of very strong tailwinds, or a much shorter route.