The classical method to determine power from internal combustion aircraft engines is to use the power charts produced by the manufacturers. But, those charts are only valid if you have the mixture set for best power. Many people, especially those with fuel injected engines, prefer to cruise with the mixture leaner than the setting for best power, which means the power charts are useless.
Several years ago I stumbled across an ancient internal Lycoming document that describes a method to determine engine power based on fuel flow data. The method was supposedly usable at any mixture setting. It is laborious to use, requiring the user to look up values on multiple charts to correct for the ratio of fuel flow to fuel flow at peak EGT, compression ratio, rpm and engine displacement. If this method works, and is usable in the real world, I’ll document it and release spreadsheets and python scripts that simplify the use of the method.
I played around with this power determination method with my RV-8 before our accident, but never got enough experience with it to draw any conclusions. But even if it works well for me, with my aircraft, I wanted to know how well it would work for other people, on other aircraft. So I launched a “science project”, wrote up test cards with a test procedure, and asked other RV flyers to do some testing and send me data.
The big question I’m trying to answer is “does this test method yield a consistent calculated power at both rich and lean mixtures?” I will attempt to answer this question by having people fly cruise speed tests, gathering data at a wide range of fuel flows with constant altitude and throttle position. A study of how TAS varies with calculated power, both rich and lean of peak EGT, should give a good indication of how well this test technique works. Also, we can compare the calculated power at mixture for best power against the Lycoming power charts.
I put out the request for data on Sunday morning, and the first data arrived overnight Sunday night. So far I only have results from two different test points on one aircraft, but I am quite encouraged by how the power calculation method worked on that aircraft.
Webb Willmott sent me data from 2400 rpm, full throttle, at 8,500 and 10,500 ft, from his RV-7A, with Superior IO-360-B series engine.
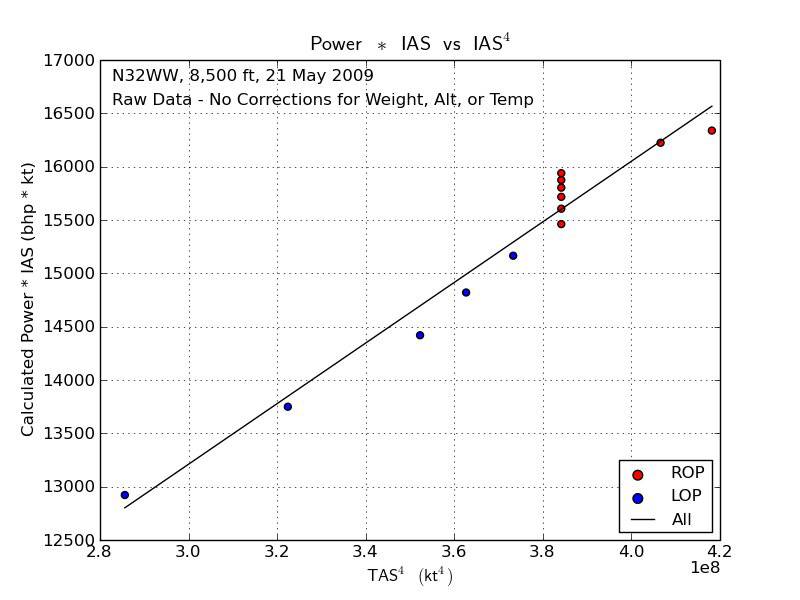
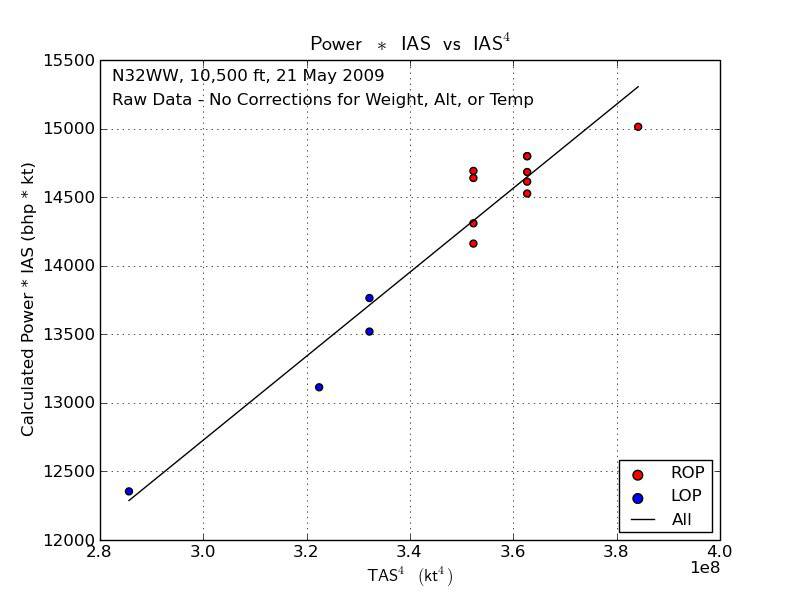 The first two plots are IAS * calculated power vs IAS^4. In a perfect world, with perfect data, zero error in the airspeed system, constant prop efficiency, and a perfect way to calculate power, all points would fall on a straight line. The real world is not perfect, so we see some noise in the data. But the ROP and LOP points line up nicely, which suggests that this method of calculating power may be able to account for different mixture settings.

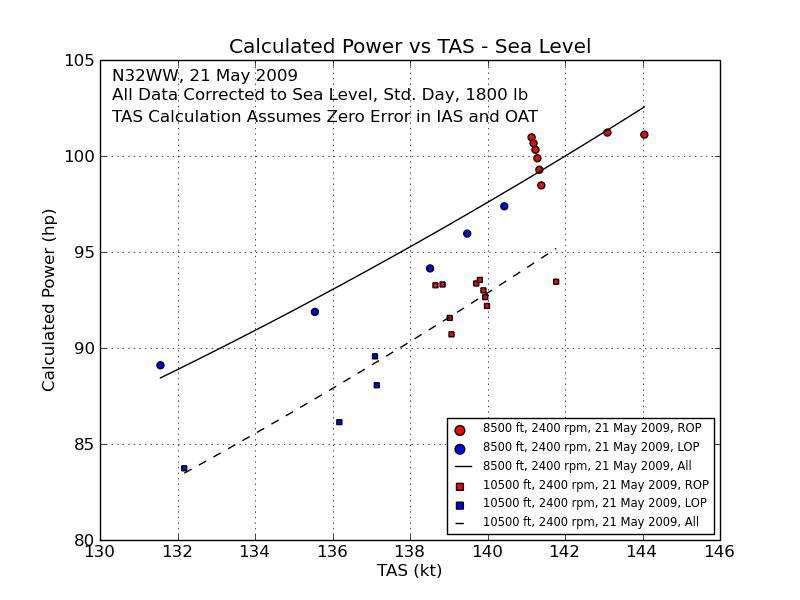
 The next two plots are calculated power vs IAS. You can see that if we assume any of the points could have an error of one kt (which is a very small error, given the normal variations in speed) that all points fall within one hp of the fit line. Very encouraging.
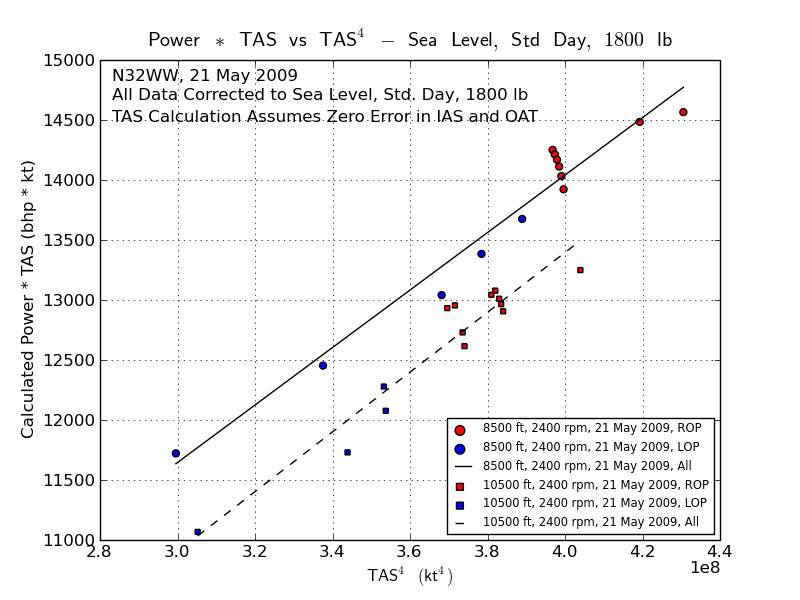
 Finally, I used standard methods to correct each test point to sea level, standard day, 1800 lb weight. In a perfect world, all points at all altitudes, temperatures, weights and power settings would fall on a straight line if you plotted TAS * calculated power vs TAS^4 (after correcting both speed and power to sea level, standard day, standard weight). We see that there is a small difference between the 8,500 ft and 10,500 ft test points after they were corrected to sea level conditions.
The discrepancy between the 8,500 ft and 10,500 ft points could be caused by any number of things. It could be due to errors in the power calculation method, errors in the fuel flow, errors in the OAT, errors in the IAS, errors in the weight, variations in prop efficiency, etc. I’m experimenting with hypothetical adjustments in all these inputs, to see which ones are the most likely source of the discrepancy.
I hope to get data from several more RVs, and will then make a decision on whether this power calculation method is worth pursuing. If it looks workable, I’ll write up an article for Kitplanes magazine, and release a spreadsheet and python scripts that do the calculation. I hope to explain how to use this power calculation method + a few hours of flight testing to produce cruise performance charts for your aircraft, valid with the mixture at either rich or lean of peak EGT.
Test Procedure
If any readers are interested in feeding me some data, the test procedure is as follows:
Before flight, ensure you know the aircraft weight by accounting for all the stuff in the cockpit and baggage areas. If the item wasn’t on the aircraft when the weight and balance was done, either remove it or figure out how much it weighs and account for in the gross weight. Fill the fuel tanks, and record the calculated gross weight with full fuel, all occupants, etc.
Find a test area with very smooth air, and no vertical air motion. No mountain waves, etc. Record the pressure altitude (i.e. with altimeter set to 29.92) and OAT. I don’t care what altitude you use, as long as the air is smooth and has no vertical motion.
Set the desired rpm and MP, and don’t change them for the duration of the test. Record the rpm.
Slowly adjust the mixture to find peak EGT, and record the fuel flow at peak EGT. Note: the test method assumes that all cylinders peak at the same fuel flow, but the real world doesn’t work like that. Ideally you would record the fuel flow when each cylinder peaked (i.e. record four or six fuel flow values). Or, if they all peak at about the same fuel flow, give me an eyeball average of the fuel flow at peak EGT for all cylinders. Don’t send just the fuel flow when the first cylinder peaks.
When looking for fuel flow at peak EGT, be very aware of how quickly or slowly your EGT system responds to changes in mixture. If your EGT system is slow to respond, you’ll need to be very patient when adjusting the mixture, to let the EGT stabilize after each change. Otherwise it is quite possible to record a too low fuel flow at peak EGT.
Without changing throttle position, prop control (constant speed prop) or altitude, record level flight IAS vs fuel flow for a wide range of fuel flow values, both ROP and LOP. The wider the range of fuel flows the better, as long as the engine is running smoothly, with no misfiring. At each fuel flow, wait long enough for the IAS to stabilize, which may take several minutes. Record fuel flow, fuel remaining, and IAS.
For extra brownie points, you could repeat the above at one or more different conditions. I.e. change one or more of the altitude, rpm or MP. Data from several different flights is OK, as long as the aircraft CG remains pretty much the same - i.e. if you have an RV-4 or -8, don’t do some flights with a passenger, and some without, as that will affect the relationship between power and speed.
Send me the following data:
Engine modelEngine compression ratioType of ignition systemProp type (I don’t need a detailed model number - I just need to know if it is constant speed or fixed pitch)Aircraft gross weight on the day of the test with full fuel.For each altitude, rpm and MP that you have data, send me: * Altitude * OAT * RPM, and * Fuel flow at peak EGT for each cylinder
Then, adjust the mixture to a wide range of fuel flows, both rich and lean of peak EGT. Wait at each mixture setting long enough for the IAS to stabilize, then record: * fuel flow * fuel remaining * rpm (only needed for fixed pitch prop), and * IAS
Remarks - I am particularly interested in the stability of your fuel flow indication. I.e., with constant rpm, MP, altitude, mixture control, how much does the fuel flow indication vary up and down? Knowing this will help me interpret any noise in the results - i.e. is the noise due to issues with the method to calculate engine power, or is it possibly due to uncertainty in the fuel flow data).
Test Cards
I created test cards for constant speed prop (pdf format) and fixed pitch prop (pdf format).