WWII Aircraft Performance Data Archive
- Details
- Written by Kevin Horton
- Hits: 6842
The internet is like an old attic where you discover hidden treasures buried under old blankets. I was surfing the web, looking for something, and stumbled across an amazing archive of scanned performance data for 1940s fighter aircraft. You’ll find copies of flight test reports from many of the fighter aircraft used by Great Britain, the USA, Germany, and Japan during World War II. This includes the very earliest jets. We find such gems as:
- performance comparison of Spitfire Mk I vs Me 109E,
- Mosquito performance summary,
- performance comparison of many English and German fighters,
- combat evaluations of Zero, Wildcat, Hellcat and Corsair,
- P-80 performance trials, etc.
In short, it is a gold mine for anyone interested in World War II fighter aircraft.
Airport Visit
- Details
- Written by Kevin Horton
- Hits: 3175
It has been a good week. I’ve been doing several sessions a day of stretching the Achilles tendon, and then walking around supporting most of the right leg weight with crutches. I’m up to about 50 lb of weight on the leg now, and the ankle is feeling better than it was a few days ago.
Terry is still working through weaning herself off the back brace. The first few days, whenever the back brace was off she would feel extremely fragile, with it taking a lot of effort to ensure the back remained completely vertical. But yesterday and today, the muscles in her torso are obviously becoming much stronger, so that they are happy to support the back for up to three hours at a time. She starts physiotherapy tomorrow.
Today I got out to the Smiths Falls airport, to partake in the annual fly-in breakfast. Barry, an aviation enthusiast who lives close by, offered to drive me there and back. It was great to get back to the airport, talk with other club members, and to check on the aircraft. Thanks Barry!
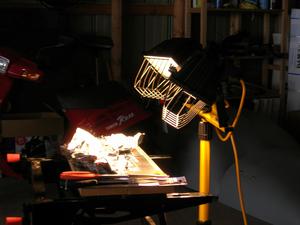 I used the opportunity to dry out the desiccant plugs in the cylinders. I had planned to dry out my spare desiccant plugs at home yesterday, but I discovered that I had forgotten to bring them back from the hangar. Alfio, a local RV-9A builder, suggested that a halogen lamp could be used to dry the plugs out. I made some little tin foil “bowls”, and the halogen lamp dried out the plugs in about 45 minutes.
Milestones
- Details
- Written by Kevin Horton
- Hits: 3309
Terry had a big milestone today - she had her back brace off for a little while this morning and again this afternoon. It was really good to see her out of the back brace, even if only for a little while. The visit with her neurosurgeon went well yesterday. The X-ray showed the expected healing, so he gave her clearance to start weaning her self off the back brace. She will have it off for progressively longer periods each day, to allow the muscles in her torso to get used to having to work for a living again. On Monday she’ll start physiotherapy.
I’ve been working on stretching out the Achilles tendon so I can get enough range of movement in the ankle to allow normal walking. The range of movement is increasing, ever so slowly. Several times a day I spend a few minutes stretching, then hobble around, using crutches to limit the weight on the right leg. The ankle feels pretty ugly the first minute or two, then it starts getting warmed up and feels much better. I still have an awful long way to go, as I’m only up to about 25 lb of weight on the leg, and I can’t go for too far. But every day is better than the last.
The left wrist is working pretty well. It still doesn’t have quite the old range of motion yet, but it is pretty functional, and I can see improvement every week.
I need to make two more big milestones before I can go back to work. I need to be able to get up the stairs to the bedroom area by myself, and I need enough strength in the leg so I can drive. At the moment, we have an attendant car lady who comes by every morning to help us with the morning routine. She helps me get to the shower and back, but the schedule is such that by the time the whole morning routine is done it is pretty late to be leaving for work. I suspect Terry will be driving before me, assuming her back continues to cooperate.
All in all, we’re doing fairly well.
Power Calculation from Fuel Flow - Fixed Pitch Prop
- Details
- Written by Kevin Horton
- Hits: 5336
The basic method as described by Lycoming assumes the rpm is the same with mixture for peak EGT as it is at the fuel flow of interest. Thus the method, as described, is only workable for a constant speed prop, as the rpm will vary with fuel flow if you have a fixed pitch prop. I created a hypothetical extension to Lycoming’s method, that assumes that fuel flow will vary linearly with rpm for small changes of rpm at a constant MP, altitude and mixture control position. So, for example, if we have 2500 rpm and 10 gph at peak EGT, and 9 gph and 2400 rpm at the fuel flow of interest, I assume that if you could keep rpm constant, the fuel flow at peak EGT at 2400 rpm would be = 10 * 2400/2500 = 9.6 gph. Given that this calculation method is much less sensitive to errors in fuel flow at peak EGT as it is to fuel flows at the test condition, I think this approach will work for fixed pitch props.
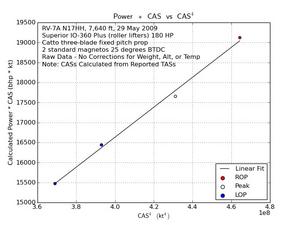
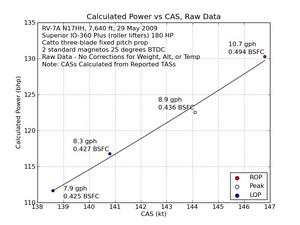
I got some more power from fuel flow data today - this data was from Howard Handelman’s RV-7A with “Superior IO-360 Plus (roller lifters) 180 HP”, two mags and a Catto three blade fixed pitch prop. He got me four different fuel flows at about 2500 rpm at 7600 ft - one pretty close to peak power rich of peak EGT, and one at peak EGT and two more lean of peak EGT. I ran the data through the Lycoming power from fuel flow method, with the hypothetical addition to the method to make it work for fixed pitch prop. The variation of speed vs calculated power looks very good, which suggests that this power calculation method provides powers that vary correctly with fuel flow. If you look at the plot of Calculated Power vs CAS, you’ll see that all four points are very, very close to the line of perfect fit. This suggests that this method does a pretty good job of handling the differences in specific fuel consumption between rich of peak and lean of peak ops.
It is too early to declare victory yet, but the first two results are encouraging. Note: I don’t yet have a very good idea as to whether this method accurately calculates power. At the moment my investigation has focused on whether it provides a calculated power that varies correctly as the mixture varies. The question of whether it provides the correct power value is a more difficult one to answer. I hope to eventually have enough data to be able to compare the power values from the classical Lycoming power charts. But even that will not provide a definitive answer, as there are so few of our engines actually match a configuration that was delivered by Lycoming, so it is hard to find a good power chart to use for every engine.
Thanks Howard.
Partial Weight on the Right Leg
- Details
- Written by Kevin Horton
- Hits: 3258
I had another visit with the orthopaedic surgeon yesterday afternoon. The X-rays and visual inspection showed the expected healing, so he gave me clearance to start putting partial weight on the right leg. He defined partial weight as 10 lb on day 1, increasing by no more than 10 lb a day, as the pain allowed. He said to stand supported by crutches, with the right leg on bathroom scales, and to calibrate my sense of what 10 lb felt like, then to walk around the house putting that much weight on the leg.
I was a bit disappointed, having been looking forward to getting clearance for partial weight on the leg, and sort of expecting that it would mean perhaps 50 lb. But, after trying the leg out this morning, I learned that 10 lb feels like a lot more than it used to, and that is about all the ankle is ready for right now. I spent a fair bit of time working on stretching the tendon that goes up the back of the calf, as at the moment I can just get the heel on the floor if the leg is at 90 degrees to the foot, but I need to be able to push the knee forward with the foot flat on the floor so I can walk. I either need to get that tendon stretched out, or start wearing high heels. :)
The right ankle is a bit sore right now from its exercise today, but I am happy to have passed to the next phase of the recovery.
Power Calculation From Fuel Flow Data
- Details
- Written by Kevin Horton
- Hits: 4924
The classical method to determine power from internal combustion aircraft engines is to use the power charts produced by the manufacturers. But, those charts are only valid if you have the mixture set for best power. Many people, especially those with fuel injected engines, prefer to cruise with the mixture leaner than the setting for best power, which means the power charts are useless.
Several years ago I stumbled across an ancient internal Lycoming document that describes a method to determine engine power based on fuel flow data. The method was supposedly usable at any mixture setting. It is laborious to use, requiring the user to look up values on multiple charts to correct for the ratio of fuel flow to fuel flow at peak EGT, compression ratio, rpm and engine displacement. If this method works, and is usable in the real world, I’ll document it and release spreadsheets and python scripts that simplify the use of the method.
I played around with this power determination method with my RV-8 before our accident, but never got enough experience with it to draw any conclusions. But even if it works well for me, with my aircraft, I wanted to know how well it would work for other people, on other aircraft. So I launched a “science project”, wrote up test cards with a test procedure, and asked other RV flyers to do some testing and send me data.
The big question I’m trying to answer is “does this test method yield a consistent calculated power at both rich and lean mixtures?” I will attempt to answer this question by having people fly cruise speed tests, gathering data at a wide range of fuel flows with constant altitude and throttle position. A study of how TAS varies with calculated power, both rich and lean of peak EGT, should give a good indication of how well this test technique works. Also, we can compare the calculated power at mixture for best power against the Lycoming power charts.
I put out the request for data on Sunday morning, and the first data arrived overnight Sunday night. So far I only have results from two different test points on one aircraft, but I am quite encouraged by how the power calculation method worked on that aircraft.
Webb Willmott sent me data from 2400 rpm, full throttle, at 8,500 and 10,500 ft, from his RV-7A, with Superior IO-360-B series engine.
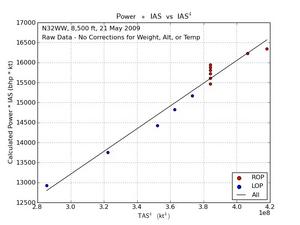
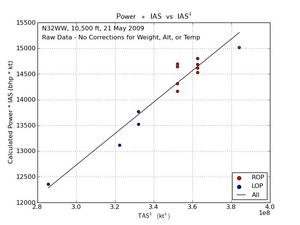 The first two plots are IAS * calculated power vs IAS^4. In a perfect world, with perfect data, zero error in the airspeed system, constant prop efficiency, and a perfect way to calculate power, all points would fall on a straight line. The real world is not perfect, so we see some noise in the data. But the ROP and LOP points line up nicely, which suggests that this method of calculating power may be able to account for different mixture settings.
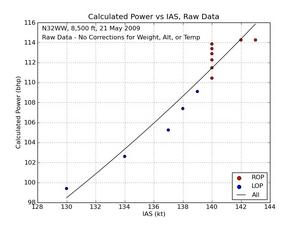
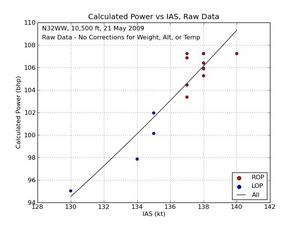 The next two plots are calculated power vs IAS. You can see that if we assume any of the points could have an error of one kt (which is a very small error, given the normal variations in speed) that all points fall within one hp of the fit line. Very encouraging.
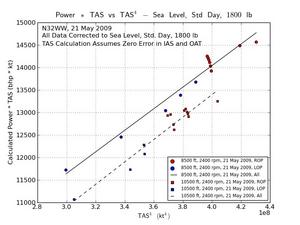
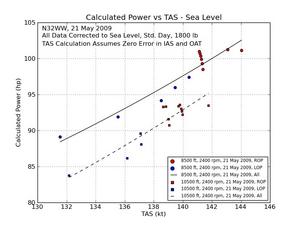 Finally, I used standard methods to correct each test point to sea level, standard day, 1800 lb weight. In a perfect world, all points at all altitudes, temperatures, weights and power settings would fall on a straight line if you plotted TAS * calculated power vs TAS^4 (after correcting both speed and power to sea level, standard day, standard weight). We see that there is a small difference between the 8,500 ft and 10,500 ft test points after they were corrected to sea level conditions.
The discrepancy between the 8,500 ft and 10,500 ft points could be caused by any number of things. It could be due to errors in the power calculation method, errors in the fuel flow, errors in the OAT, errors in the IAS, errors in the weight, variations in prop efficiency, etc. I’m experimenting with hypothetical adjustments in all these inputs, to see which ones are the most likely source of the discrepancy.
I hope to get data from several more RVs, and will then make a decision on whether this power calculation method is worth pursuing. If it looks workable, I’ll write up an article for Kitplanes magazine, and release a spreadsheet and python scripts that do the calculation. I hope to explain how to use this power calculation method + a few hours of flight testing to produce cruise performance charts for your aircraft, valid with the mixture at either rich or lean of peak EGT.
Test Procedure
If any readers are interested in feeding me some data, the test procedure is as follows:
Before flight, ensure you know the aircraft weight by accounting for all the stuff in the cockpit and baggage areas. If the item wasn’t on the aircraft when the weight and balance was done, either remove it or figure out how much it weighs and account for in the gross weight. Fill the fuel tanks, and record the calculated gross weight with full fuel, all occupants, etc.
Find a test area with very smooth air, and no vertical air motion. No mountain waves, etc. Record the pressure altitude (i.e. with altimeter set to 29.92) and OAT. I don’t care what altitude you use, as long as the air is smooth and has no vertical motion.
Set the desired rpm and MP, and don’t change them for the duration of the test. Record the rpm.
Slowly adjust the mixture to find peak EGT, and record the fuel flow at peak EGT. Note: the test method assumes that all cylinders peak at the same fuel flow, but the real world doesn’t work like that. Ideally you would record the fuel flow when each cylinder peaked (i.e. record four or six fuel flow values). Or, if they all peak at about the same fuel flow, give me an eyeball average of the fuel flow at peak EGT for all cylinders. Don’t send just the fuel flow when the first cylinder peaks.
When looking for fuel flow at peak EGT, be very aware of how quickly or slowly your EGT system responds to changes in mixture. If your EGT system is slow to respond, you’ll need to be very patient when adjusting the mixture, to let the EGT stabilize after each change. Otherwise it is quite possible to record a too low fuel flow at peak EGT.
Without changing throttle position, prop control (constant speed prop) or altitude, record level flight IAS vs fuel flow for a wide range of fuel flow values, both ROP and LOP. The wider the range of fuel flows the better, as long as the engine is running smoothly, with no misfiring. At each fuel flow, wait long enough for the IAS to stabilize, which may take several minutes. Record fuel flow, fuel remaining, and IAS.
For extra brownie points, you could repeat the above at one or more different conditions. I.e. change one or more of the altitude, rpm or MP. Data from several different flights is OK, as long as the aircraft CG remains pretty much the same - i.e. if you have an RV-4 or -8, don’t do some flights with a passenger, and some without, as that will affect the relationship between power and speed.
Send me the following data:
Engine modelEngine compression ratioType of ignition systemProp type (I don’t need a detailed model number - I just need to know if it is constant speed or fixed pitch)Aircraft gross weight on the day of the test with full fuel.For each altitude, rpm and MP that you have data, send me: * Altitude * OAT * RPM, and * Fuel flow at peak EGT for each cylinder
Then, adjust the mixture to a wide range of fuel flows, both rich and lean of peak EGT. Wait at each mixture setting long enough for the IAS to stabilize, then record: * fuel flow * fuel remaining * rpm (only needed for fixed pitch prop), and * IAS
Remarks - I am particularly interested in the stability of your fuel flow indication. I.e., with constant rpm, MP, altitude, mixture control, how much does the fuel flow indication vary up and down? Knowing this will help me interpret any noise in the results - i.e. is the noise due to issues with the method to calculate engine power, or is it possibly due to uncertainty in the fuel flow data).
Test Cards
I created test cards for constant speed prop (pdf format) and fixed pitch prop (pdf format).
